
Yield mapping isn’t just for large commercial operations anymore. With John Deere Operations Center, farmers of all sizes can collect, analyze, and use yield data to make smarter decisions about their fields. But collecting data is only valuable if you’re actually using it to improve your operation. Here’s how to get the most from yield mapping technology and turn harvest data into actionable insights for next season.
What Yield Mapping Tells You
Beyond Average Yields
Yield mapping reveals field variability that average yields hide. Two fields might both average 180 bushels per acre, but one could have consistent production while the other swings from 140 to 220 bushels depending on location.
Key Insights:
- High and low-performing areas within fields
- Patterns related to soil types or drainage
- Equipment performance issues like skips or overlaps
- Year-over-year trends in specific field zones
The real value comes from correlating yield data with your management decisions. Operations Center makes it easy to overlay yield maps with application records, soil data, and weather information to understand what’s driving performance.
Getting Started
Equipment Requirements
To create yield maps, you need a John Deere combine with yield monitoring capability, GPS receiver, and an active Operations Center account. Most modern John Deere combines come equipped with these capabilities.
Setup Essentials
Before your first harvest with yield mapping:
- Calibrate yield monitor sensors for accurate data
- Verify GPS accuracy and coverage
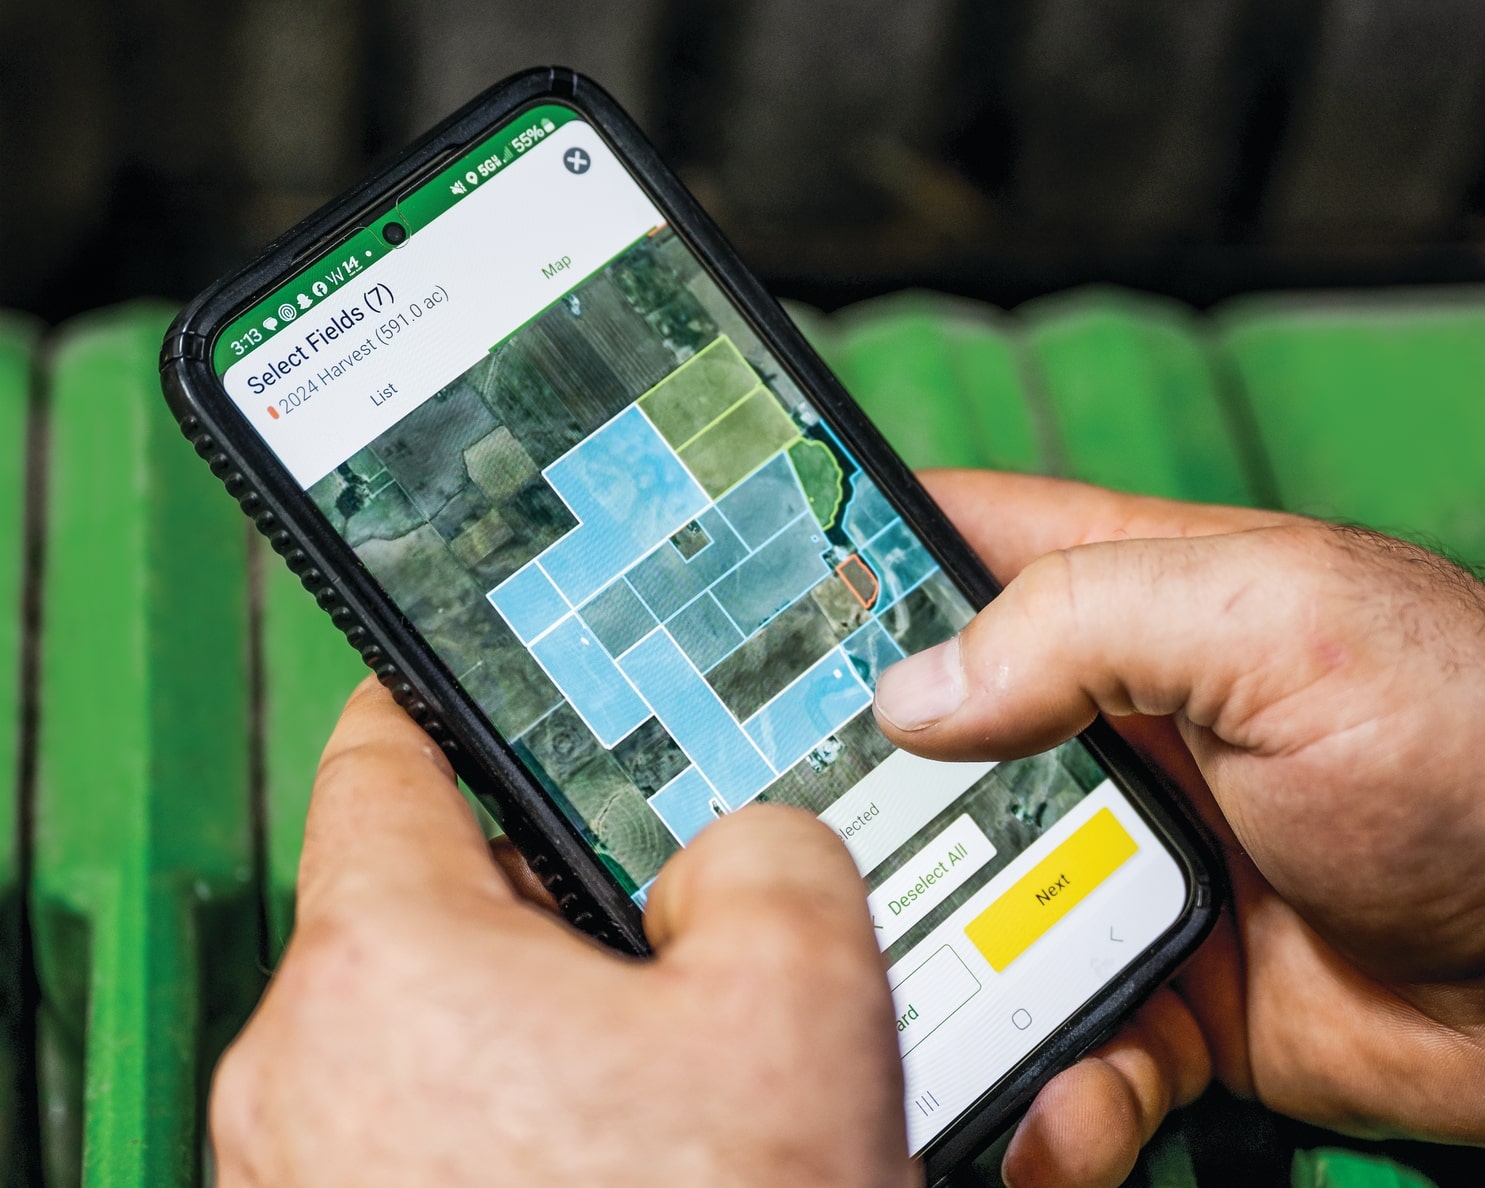
- Set up field boundaries in Operations Center
- Test data transfer to ensure information flows properly
Proper calibration is critical. Inaccurate data is worse than no data because it leads to wrong decisions.
Using Yield Data Effectively
Analyze Patterns
Don’t just look at where yields were high or low. Ask why:
- Do low-yield areas correlate with wet spots or poor drainage?
- Are high-yield zones associated with specific soil types?
- Do patterns repeat year after year or change with weather?
Informed Input Decisions
Yield maps should inform your input strategy:
- Variable rate seeding based on yield potential
- Targeted fertilizer application to address deficiencies
- Drainage improvements in consistently poor areas
Track Results Over Time
Operations Center stores historical data, letting you see multi-year trends. This long-term view helps separate weather-related variation from consistent field characteristics.
Mistakes to Avoid
Data Collection without Action: The most common mistake is gathering yield data but never using it for decision-making. If you’re not prepared to analyze and act on the information, you’re wasting time.
Poor Calibration: Yield monitors need regular calibration to stay accurate. Running uncalibrated monitors produces misleading data that can lead to costly input decisions.
Ignoring Data Quality: Not all yield data is good data. Points collected during turns, stops, or equipment adjustments should be filtered out.
Maximizing Value
Integrate and Share
Operations Center works best when integrated with other precision farming tools. Import soil test results, connect weather data, and share information with agronomists and crop consultants for better recommendations.
Get Support
Not sure how to interpret yield maps or set up Operations Center? Heritage Tractor’s precision ag specialists can help you get started and make the most of your data.
Ready to Invest?
Yield mapping with John Deere Operations Center transforms harvest data into actionable insights that improve profitability. Start simple: collect good data, analyze basic patterns, and make one or two management changes based on what you learn. As you gain confidence, expand your analysis and precision agriculture practices.
Contact Heritage Tractor to discuss Operations Center setup, training, or how to integrate yield data into your management strategy.
